Countermapping: how new maps rewrite the world

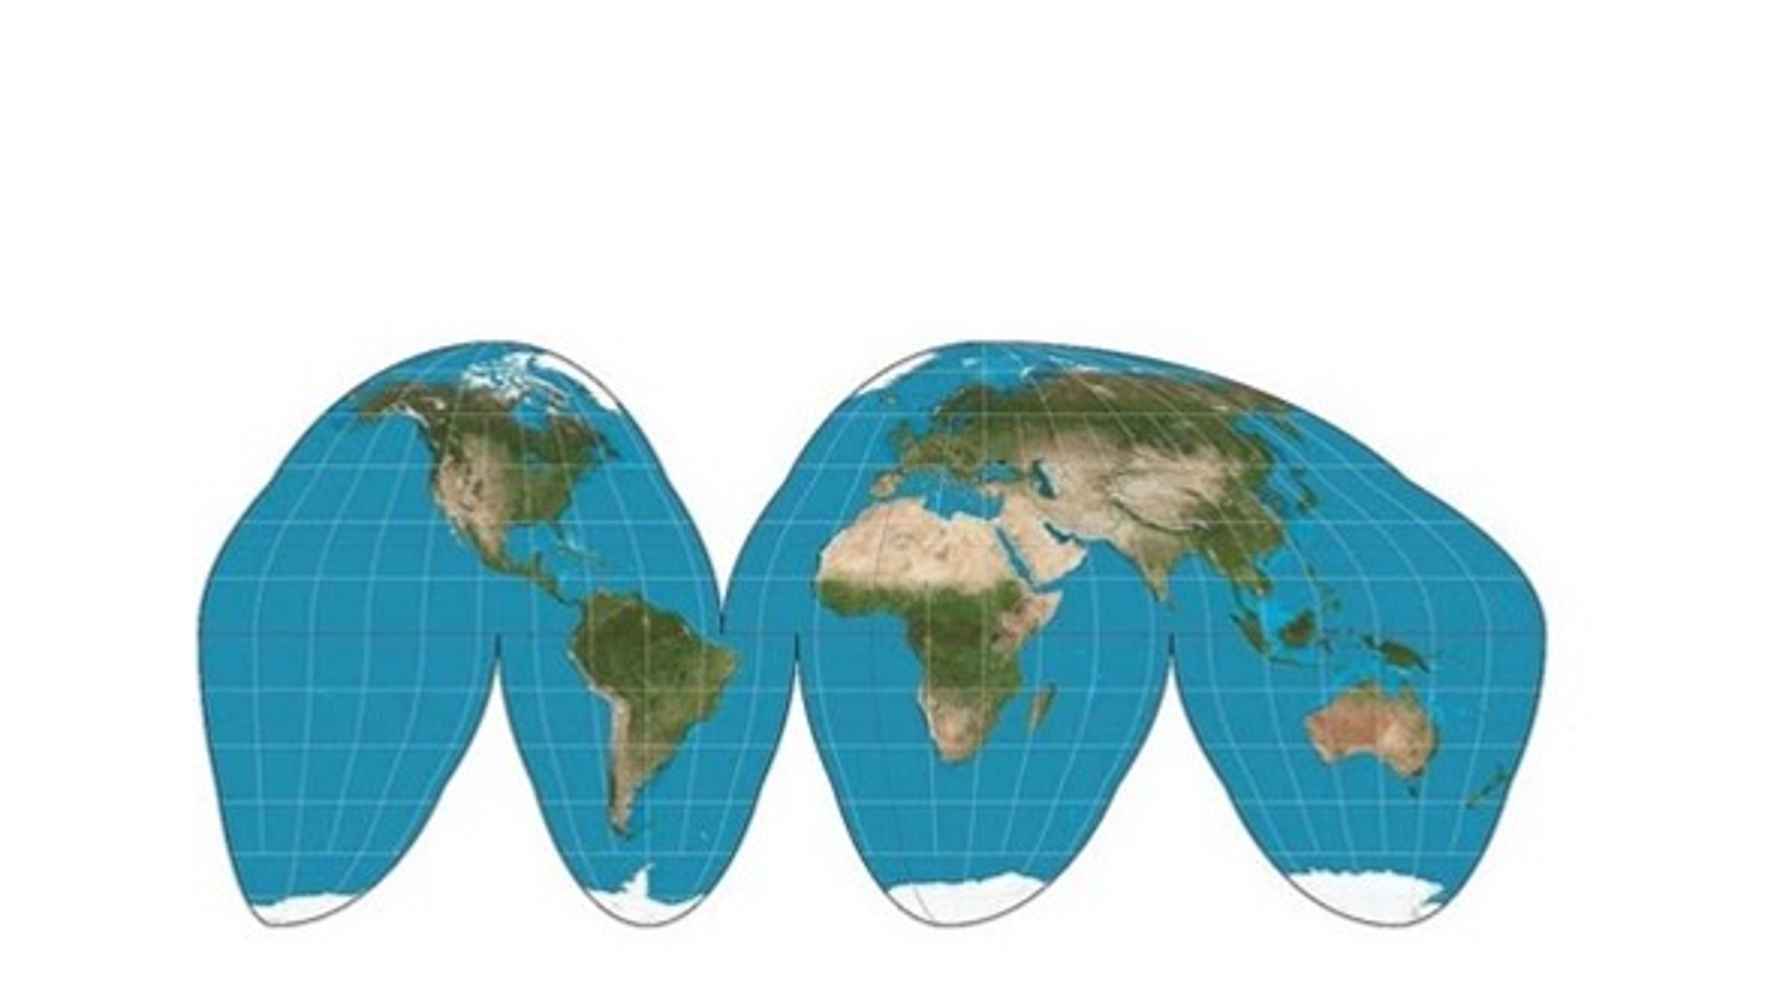
Africa wants to be shown as the correct size on the world map, as recently reported on NOS.nl. Maps can restore people's rights, as UvA PhD candidate Jochem Kootstra of the Amsterdam University of Applied Sciences (AUAS) knows. He is doing his PhD on 'countermapping': alternative maps that help underexposed groups achieve their goals.
Maps reflect underlying power structures. Researcher Jochem Kootstra (AUAS) knows this better than anyone: he is investigating how digital countermapping - alternative ways of making maps - can be used across the globe to give a voice to underrepresented groups. He has been researching this topic for about two years, and recently started his doctoral research at the University of Amsterdam.
Guiding influence
According to Kootstra, the recent focus on errors in the most widely used world mapobviously a good thing. But more attention could be paid to the guiding influence of (digital) maps, as far as the researcher is concerned. And particularly for Google Maps, which further increases inequality.

‘We worry about Instagram, Facebook and Google as commercial, manipulative platforms. Google Maps is all that as well, but we don’t talk about that.’
Jochem Kootstra, lecturer and researcher countermapping
Firstly, Google Maps is also based on the much-discussed 'Mercator projection' of the 16th century; the world map also seen in the Grote Bosatlas. This map is incorrect, considering the scale of the countries and continents. Africa, for instance, is in reality twice the size of Russia (and bigger than Canada, the US and China combined).
This way, the projection guides our worldview: it confirms historical power structures, in which Western countries saw themselves as the centre of the world.

Efficient
However, the Mercator projection is an efficient and effective map, says Kootstra, intended for navigation. The same goes for Google Maps, which is based on it: the app clearly shows how to travel from A to B, and is therefore convenient for users.
Inequalities amplified
But Google Maps is not an objective representation of the world - there is a clear commercial interest behind the application. ‘Maps strengthens Google's ecosystem, which is focused on profit. Our search and location data is used to better highlight paying partners, and to sell ads.’
Public organisations and small, local businesses are thus less visible than commercial parties, which in turn makes them less likely to be found. This same difference occurs with tourist hotspots: these get lots of reviews, photos and updates, making them look vibrant and trustworthy, while the representation of less affluent neighbourhoods often remains empty or outdated.
Meanwhile, data and algorithms reinforce this process: the more digital interaction and searches there are around a place or brand name, the more prominently it appears on the map. Less interaction means less visibility. Kootstra: ‘A local coffee shop that has toiled for years can be virtually invisible because of this, while the new Starbucks around the corner immediately appears at the top when you search for coffee.’
Avoiding dark routes
That 'distorted' view is also related to the way Google Maps is designed: everything is about efficiency, especially for cars. ‘Routes are optimised for motorists, but hardly for pedestrians, cyclists or people with disabilities. This creates inequality in accessibility.’ And efficiency is not always what you need as a user. ‘Maybe you just want to cycle the greenest route, or have the option to avoid routes with dark alleys and neighbourhoods. Maps does not currently take that into account.’

Raising student awareness
Kootstra also uses his research a lot in his lectures to Creative Business students. Visual methods are becoming increasingly important for conveying news and information, and digital maps fall in this category.
At the beginning, Kootstra often instructs students to collect their own data via Google Maps. This gives them insight into the biases of this map; culturally diverse restaurants, for example, are hardly found, while the big chains pop up everywhere. ‘Many students are just now learning that such displays on Google Maps are an advantage.’
Different view of the city
Students also engage in countermapping themselves. They look at the map of Amsterdam from their own perspective, or that of a particular target group, then use specific knowledge to cut, paste and add - to highlight the city for a particular target group.
Kootstra: ‘Students thus learn how maps are not just for navigation, but convey a certain worldview. They always reflect the knowledge and interests of their creators, showing reality through a particular lens.’
Doctoral research: diaspora of Yezidis and Gaza
In his doctoral research at the UvA, Kootstra focuses on how marginalised communities can harness countermapping for social change and justice. When is it successful, when is it not?
To do so, Kootstra takes a look at three case studies. First, the Ruptured Atlas - a digital map visualising the diaspora of Yezidis, following the genocide of this community in Iraq. ‘This map is being used to make this genocide, which has been partially ignored, still visible.’ Ruptured Atlas maps, for instance, have been used to change housing policy in Iraq and migration policy in the UK.
Second, Kootstra examines the Forensic Architecture project in Gaza. Through drones and sophisticated digital tools, researchers in this case are trying to make visible what is happening. These maps were presented at the International Court of Justice as visual evidence to support claims of war crimes.
Finally, Kootstra studies the Anti-Eviction Mapping Project - a countermapping project in the US that shows wrongful evictions, with help from data scientists and others.
Using the insights from the case studies, Kootstra will then set up a countermapping initiative (intervention study) around gentrification in Amsterdam North. ‘These initiatives demonstrate that countermapping can strengthen underrepresented groups and narratives, thereby contributing to empowerment and justice’, says Kootstra. ‘However, more research is needed to understand how that impact can become sustainable.’
Jochem Kootstra PhD at the UvA with an NWO doctoral grant for teachers. His supervisor is professor of Critical Data Studies Stefania Milan. As a lecturer and researcher, he is associated with the degree programme Creative Business and the research group Civic Interaction Design of the Amsterdam University of Applied Sciences (AUAS).